
Extensive 5-Foot Diagram Depicts More Than 4,000 Years of World History
During the 1920s and 1930s, “outlines” gained traction, becoming a dominant force in nonfiction book publishing. This trend aimed to make knowledge accessible, breaking down complex subjects such as philosophy, physics, and medicine into formats that were easier to digest and understand. It was not long before John B. Sparks, an English engineer, bacteriologist, and historian, embraced this movement and produced his own “outline.”
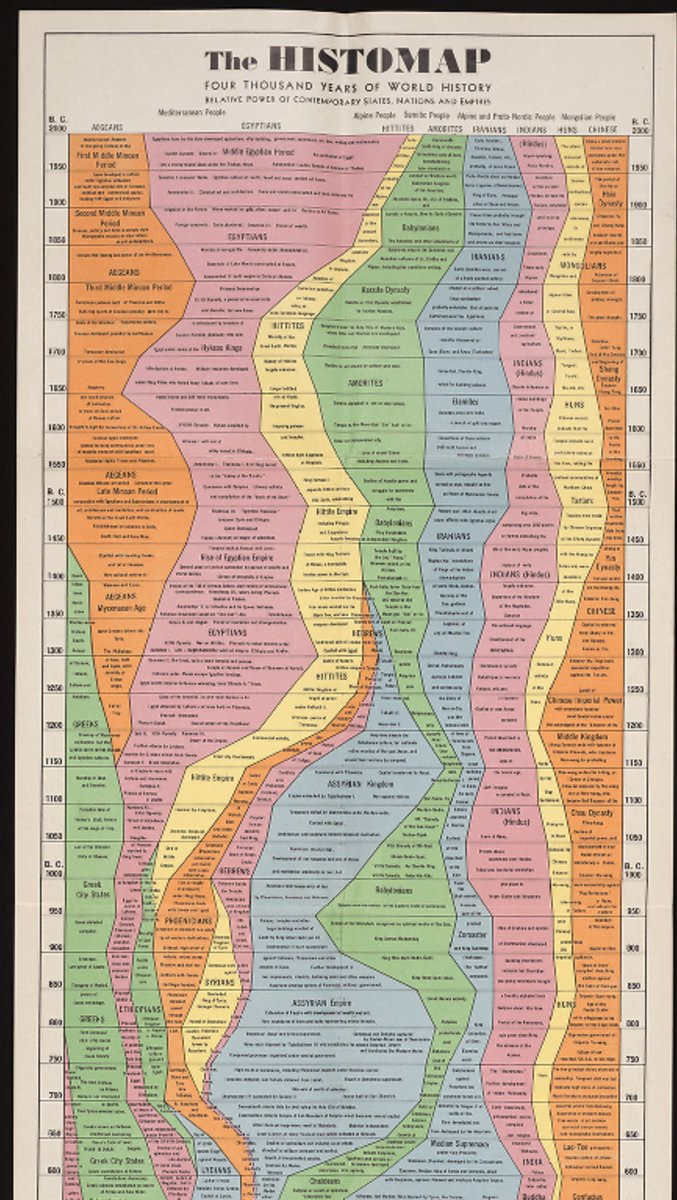
First published by Rand McNally in 1931, the *Histomap* encapsulates over 4,000 years of world history into a vivid, compact infographic. The design primarily features several colorful streams that intertwine and flow into each other as time advances toward the present. Each stream illustrates the progression of different civilizations, commencing in 2000 BCE with the Aegeans, Egyptians, Hittites, Amorites, Iranians, Indians, Huns, and Chinese. As we journey across the 5-foot-long map, we observe various societies rise while others diminish, depicting what Sparks referred to as the “relative power of contemporary states, nations, and empires.”
As a historical piece, the *Histomap* remains remarkable nearly 100 years later, particularly when considering the breadth of information it imparts. Nowadays, we can search the Internet for answers and resources, sifting through a centralized database without needing to read multiple books. In the early 1900s, “outlines” acted as a precursor to the Internet, striving to compile and categorize facts into a singular comprehensive entity. In this sense, the *Histomap* might be perceived as a smartphone, designed to accompany its user wherever they went. In fact, the map was initially sold in a tidy green sleeve, easily unfoldable for on-the-go reference, much like a portable road map.
The *Histomap* undoubtedly represents a significant achievement in graphic and informational design. However, it also reflects 20th-century perspectives on domination, racial groups, and imperialism. The Y-axis of the map is straightforward: it signifies time. Conversely, the X-axis is less transparent, seemingly representing the “size” of each empire. The criteria Sparks used to gauge that “size” remain ambiguous. Was the width of a civilization on the map determined by the number of subjects, the extent of territory, its artistic or cultural heritage, geopolitical impact, wealth, or military strength?
This ambiguity is exemplified by the map’s Eurocentrism, as it allocates minimal space for civilizations and cultures from Africa and the Americas prior to European colonization of the “New World” in the 15th century. The subtle distinctions between cultures are also simplified, categorized into various often racialized “peoples,” a common practice of that era.
“Clear, vivid, and stripped of elaboration, [the] *Histomap* captivates you as you trace the lines of power through time’s infinite journey,” the front cover of the map asserts [here](https://collections.library.yale.edu/catalog/2025152?child_oid=1086159). “This is the actual representation of civilization’s journey, from the mud huts of ancient peoples through the regal splendor of the middle ages to the living tapestry of life in modern America.”
However, Sparks did not halt with the “march of civilization.” He also crafted similar charts focusing on religion and evolution, both just as intricate and densely packed as the *Histomap*.
For a more detailed exploration of a digital version of the *Histomap*, visit [Yale University Library](https://collections.library.yale.edu/catalog/2025152?child_oid=1086159).
In 1931, John B. Sparks generated the *Histomap*, compressing over 4,000 years of global history into an engaging infographic. (Click image to enlarge.)
Sources: [*The histomaps, four thousand years of world history*](https://collections.library.yale.edu/catalog/2025152?child_oid=1086159); [*Infographic: 4,000 Years Of Human History Captured In One Retro Chart*](https://www.fastcompany.com/1673266/infographic-4000-years-of-human-history-captured-in-one-retro-chart); [*The Entire History of the World—Really, All of It—Distilled Into a Single Gorgeous Chart*](https://slate.com/human-interest/2013/08/the-1931-histomap-the-entire-history-of-the-world-distilled-into-a-single-map-chart.html); [*The History of the World in One Beautiful, 5‑Foot-Long Chart*](https://www.openculture.com/2025/06/the-history-of-the-world-in-one-beautiful-5-foot-long-chart.html)